Reference Architecture: EKS Fargate nodes down or in NotReady or Unknown status. 503
A customer asked: > I have a EKS Fargate-backed cluster that is running the AWS Sample App that was delivered with my Reference Architecture. One or more of the app environments is no longer healthy and is now returning a 503. How can I debug and fix this?
If you're seeing the following screen for one of your app accounts (dev, stage, prod) and if you're running EKS, this answer will help you diagnose and fix the underlying problem: 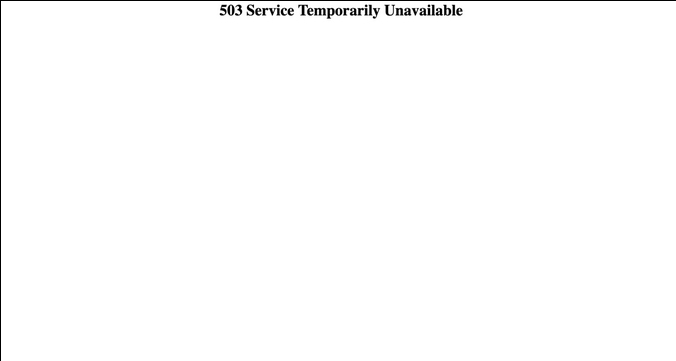 # 1. Get access to your EKS cluster Open the `docs/` folder in your infrastructure-live repository and find the document named `03-deploy-apps.md`. In this document, there is a section that explains how to gain access to your EKS cluster. First, you will need to configure your own access to your Reference Architecture accounts. If you have not already done so, visit the `docs/02-authenticate.md` file and follow the steps to set up your access to your accounts. Ensure you complete the section titled **Authenticate to AWS via the CLI**. Note there is a section in this guide where we've already generated a valid `~/.aws/config` file for you to use alongside [aws-vault](https://github.com/99designs/aws-vault). For the remainder of this guide, we'll assume you configured access via `aws-vault`. Once you have successfully configured your CLI access to your Reference Architecture, you can `cd` into the unhealthy environment's EKS cluster folder. Let's assume your `prod` account is unhealthy. From the root of your infrastructure-live repository, `cd` into `prod/<your-region>/prod/services/eks-cluster`. From here, first authenticate to your correct prod account, and then run `terragrunt output` in order to discover the ARN of the EKS cluster, like so: `aws-vault exec <your-prod-account-profile-name> -- terragrunt output` In your output you should find a similar entry to the following: `eks_cluster_arn = "arn:aws:eks:us-east-2:226340335990:cluster/example-prod"` Copy this ARN to your clipboard. Ensure that you have `kubergrunt` installed locally. If you don't - you can [get kubergrunt here](https://github.com/gruntwork-io/kubergrunt#installation). Next, run the following command to configure access to your EKS cluster via kubectl: `kubergrunt eks configure --eks-cluster-arn ARN_OF_EKS_CLUSTER_THAT_YOU_COPIED` You should see output similar to the following: ```bash [] INFO[2022-04-07T12:22:42-04:00] Retrieving details for EKS cluster arn:aws:eks:us-east-2:226340335990:cluster/example-prod name=kubergrunt [] INFO[2022-04-07T12:22:42-04:00] Detected cluster deployed in region us-east-2 name=kubergrunt [] INFO[2022-04-07T12:22:43-04:00] Successfully retrieved EKS cluster details name=kubergrunt [] INFO[2022-04-07T12:22:43-04:00] Loading kubectl config /home/<your-machine>/.kube/config. name=kubergrunt [] INFO[2022-04-07T12:22:43-04:00] Successfully loaded and parsed kubectl config. name=kubergrunt ``` You are now able to interact with your EKS cluster directly, with `kubectl`. # 2. Inspect your EKS cluster with `kubectl` Run `aws-vault exec <your-prod-aws-vault-profile> -- kubectl get deployments -n applications` You'll see output like the following. In this example case, both our frontend and backend deployments are unhealthy. ``` NAME READY UP-TO-DATE AVAILABLE AGE sample-app-backend-prod 0/1 1 0 42m sample-app-frontend-prod 0/1 1 0 42m ``` We can look for more information as to why by describing our deployments next. Run `aws-vault exec <your-prod-aws-vault-profile> -- kubectl describe deployments sample-app-backend-prod -n applications` ``` Name: sample-app-backend-prod Namespace: applications CreationTimestamp: Thu, 07 Apr 2022 11:41:37 -0400 Labels: app.kubernetes.io/instance=sample-app-backend-prod app.kubernetes.io/managed-by=Helm app.kubernetes.io/name=sample-app-backend-prod helm.sh/chart=k8s-service-v0.2.12 Annotations: deployment.kubernetes.io/revision: 1 meta.helm.sh/release-name: sample-app-backend-prod meta.helm.sh/release-namespace: applications Selector: app.kubernetes.io/instance=sample-app-backend-prod,app.kubernetes.io/name=sample-app-backend-prod,gruntwork.io/deployment-type=main Replicas: 1 desired | 1 updated | 1 total | 0 available | 1 unavailable StrategyType: RollingUpdate MinReadySeconds: 0 RollingUpdateStrategy: 25% max unavailable, 25% max surge Pod Template: Labels: app.kubernetes.io/instance=sample-app-backend-prod app.kubernetes.io/name=sample-app-backend-prod gruntwork.io/deployment-type=main Service Account: gruntwork-sample-app-backend Containers: sample-app-backend-prod: Image: gruntwork/aws-sample-app:v0.0.4 Ports: 8443/TCP, 8443/TCP, 8443/TCP Host Ports: 0/TCP, 0/TCP, 0/TCP Liveness: http-get https://:8443/health delay=15s timeout=1s period=30s #success=1 #failure=3 Readiness: http-get https://:8443/greeting delay=15s timeout=1s period=30s #success=1 #failure=3 Environment: CONFIG_APP_ENVIRONMENT_NAME: prod CONFIG_APP_NAME: backend CONFIG_DATABASE_HOST: database CONFIG_DATABASE_POOL_SIZE: 10 CONFIG_DATABASE_RUN_SCHEMA_MIGRATIONS: true CONFIG_SECRETS_DIR: /mnt/secrets CONFIG_SECRETS_SECRETS_MANAGER_DB_ID: arn:aws:secretsmanager:us-east-2:226340335990:secret:RDSDBConfig-hECb4Z CONFIG_SECRETS_SECRETS_MANAGER_REGION: us-east-2 CONFIG_SECRETS_SECRETS_MANAGER_TLS_ID: arn:aws:secretsmanager:us-east-2:226340335990:secret:SampleAppBackEndCA-ALpZCe Mounts: /mnt/secrets/backend-secrets from secrets-manager-scratch (rw) Volumes: secrets-manager-scratch: Type: EmptyDir (a temporary directory that shares a pod's lifetime) Medium: Memory SizeLimit: <unset> Conditions: Type Status Reason ---- ------ ------ Progressing True NewReplicaSetAvailable Available False MinimumReplicasUnavailable OldReplicaSets: <none> NewReplicaSet: sample-app-backend-prod-577fc88dbd (1/1 replicas created) Events: Type Reason Age From Message ---- ------ ---- ---- ------- Normal ScalingReplicaSet 42m deployment-controller Scaled up replica set sample-app-backend-prod-577fc88dbd to 1 ``` This confirms that our app is not available because we've not reached the desired number of replicas. Let's step one level deeper and inpsect the nodes making up our EKS cluster, keeping in mind that, since our Ref Arch was just deployed, these nodes may be backed by Fargate: # 3. Inspect your EKS cluster nodes Run `aws-vault exec <your-prod-aws-vault-profile> -- kubectl get nodes` You'll see output similar to the following: ``` NAME STATUS ROLES AGE VERSION fargate-ip-11-103-103-165.us-east-2.compute.internal Ready <none> 76m v1.21.2-eks-06eac09 fargate-ip-11-103-103-193.us-east-2.compute.internal Ready <none> 76m v1.21.2-eks-06eac09 fargate-ip-11-103-103-47.us-east-2.compute.internal Ready <none> 79m v1.21.2-eks-06eac09 ip-11-103-103-113.us-east-2.compute.internal NotReady <none> 79m v1.21.5-eks-9017834 ip-11-102-83-84.us-east-2.compute.internal NotReady <none> 79m v1.21.5-eks-9017834 ip-11-103-92-3.us-east-2.compute.internal Ready <none> 2m17s v1.21.5-eks-9017834 ``` Note the two unhealthy nodes, with status `NotReady`. You could also verify this in the AWS web console. In this particular case the nodes were unhealthy due to an underlying hardware failure on AWS's side. This leads to the kubelet on the node being unable to report its status, including its memory and CPU usage. When this happens, EKS eventually marks the Fargate node's status as `unknown`, leading to issues scheduling new healthy pods on the unknown nodes. Therefore, we can drain and delete these unhealthy nodes. This will allow EKS to detect their becoming unavailable and automatically reconcile them by launching new, hopefully healthy, nodes to replace them! # 4. Drain and delete unhealthy nodes First, we'll want to drain the nodes, which safely evicts all pods from the node and makes the node ready for maintenance or deletion: Run `aws-vault exec <your-prod-aws-vault-profile> -- kubectl drain ip-11-103-103-113.us-east-2.compute.internal` Next, delete the node. Run `aws-vault exec <your-prod-aws-vault-profile> -- kubectl delete ip-11-103-103-113.us-east-2.compute.internal` Repeat the above two steps of draining and deleting the node for the second unhealthy node. Once this is complete, EKS should kick in and provision two new healthy nodes to compensate for the unhealthy ones you just cleaned up. You can confirm this by running `aws-vault exec <your-prod-aws-vault-profile> -- kubectl get nodes`. You should see output similar to the following: ``` NAME STATUS ROLES AGE VERSION fargate-ip-11-103-103-165.us-east-2.compute.internal Ready <none> 81m v1.21.2-eks-06eac09 fargate-ip-11-103-103-193.us-east-2.compute.internal Ready <none> 81m v1.21.2-eks-06eac09 fargate-ip-11-103-87-47.us-east-2.compute.internal Ready <none> 84m v1.21.2-eks-06eac09 fargate-ip-11-103-94-175.us-east-2.compute.internal Ready <none> 55m v1.21.2-eks-06eac09 fargate-ip-11-103-95-219.us-east-2.compute.internal Ready <none> 84m v1.21.2-eks-06eac09 ip-10-102-92-3.us-east-2.compute.internal Ready <none> 7m49s v1.21.5-eks-9017834 ``` With new healthy nodes available, EKS should have been able to schedule your sample app pods on these new nodes, so things should be starting to recover. At this point, you can re-check your [AWS Sample App](https://github.com/gruntwork-io/aws-sample-app) and it should be healthy again!